
The Timewave chart displays amplitude versus time and is a sample of the raw vibration signal. Time waveform analysis can provide clues to machine condition that are not always evident in the frequency spectrum and, when available, should be used as part of the analysis program.
To activate the Timewave chart, a point with time wave data needs to be selected from the Trend or Heatmap chart. Time wave data isn't always collected when the measurement is taken. For online sensors, time wave data is only collected a couple of times per day.
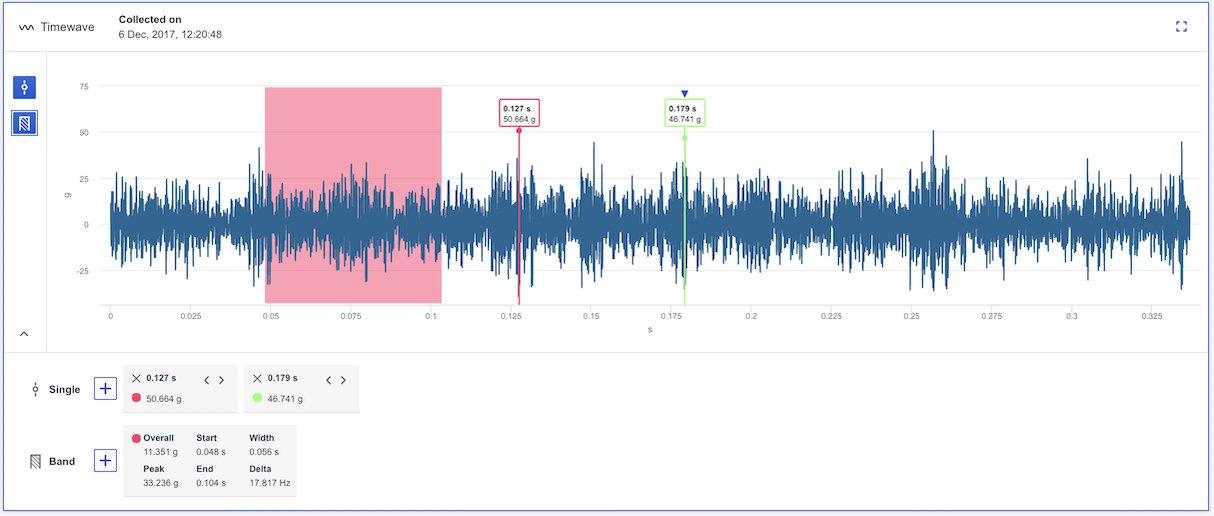
- You can use single cursors or a band cursor to analyse the time wave (shown in the image below). More information about these cursor can be found in this article: What different plot cursors are there and how do I use them?
- Keyboard shortcuts are only available if the cursor is in focus which it is when the blue triangle is present at the top of the cursor. You will find more information about each shortcut here: Which keyboard shortcuts are available in Analyze?
- It is possible to zoom in/out in the chart to view the data . More information is accessible in this article: How to zoom in the analyze charts?
Comments
0 comments
Article is closed for comments.