
There are several chart cursor tools in Enlight Centre, used when analyzing the data in different charts. Toggle the chart icons to display the specified cursor, to interact with the data and see more details.
- Keyboard shortcuts
- Sideband cursor
- Harmonic cursor
- Single cursor
- Band cursor
- Fault frequencies
- Custom frequencies
Keyboard shortcuts
You can use keyboard shortcuts to place cursors, move and adjust them. You will find more information about each shortcut here: Which keyboard shortcuts are available in Analyze?
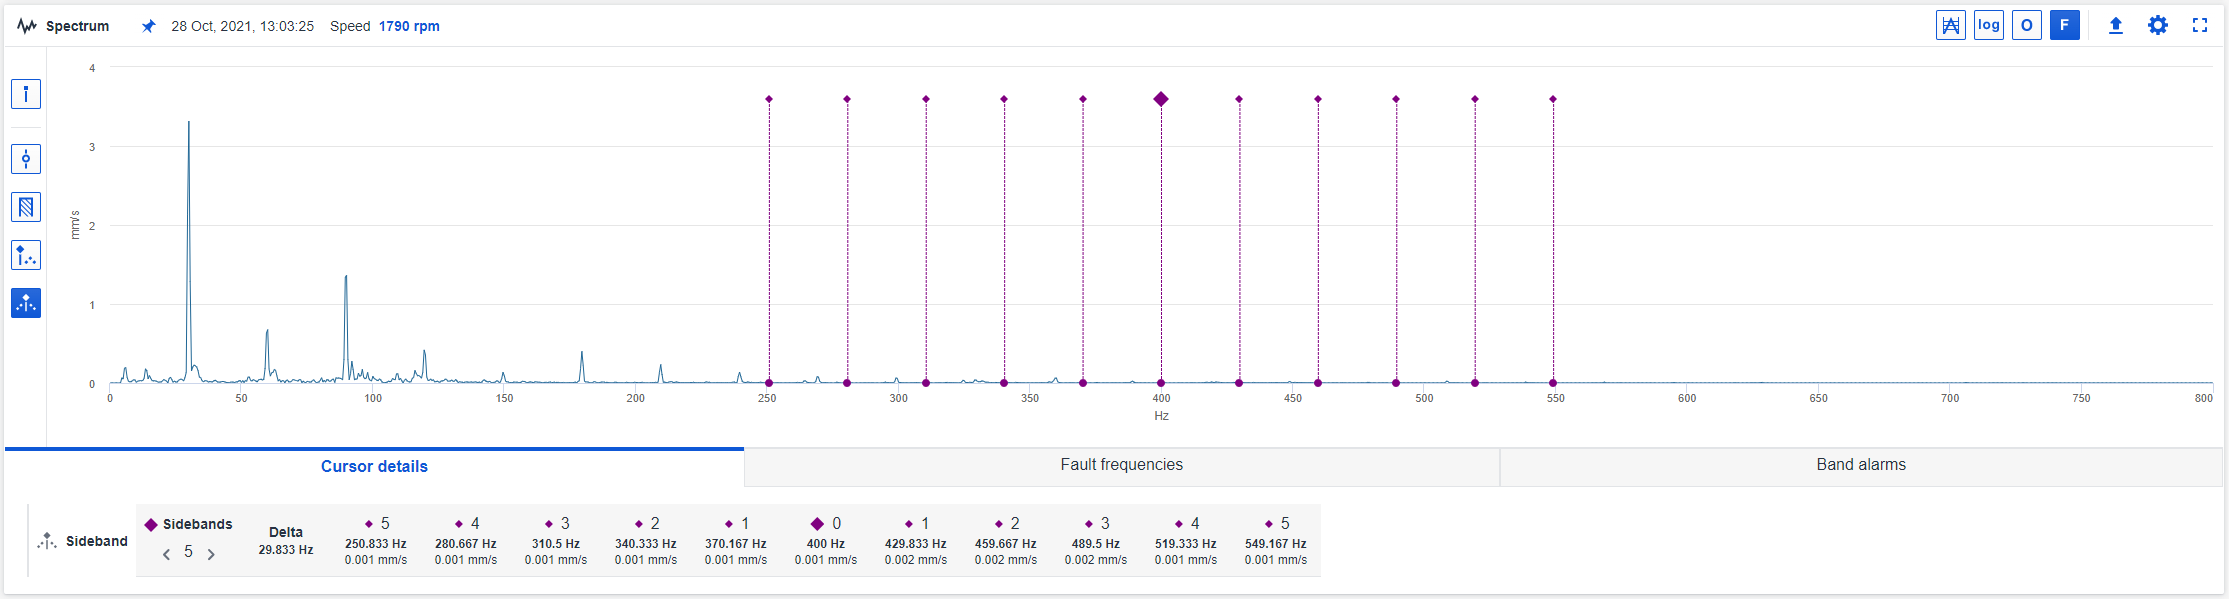
Sideband cursor
The Sideband cursor is only available for the Spectrum chart. The cursor displays additional cursors at frequencies to either side of the base cursor. For example, if the base cursor is placed at 5 orders and the sideband interval equals 1 order, then the 1st pair of sideband cursors will be located at ±1 order on either side of the base cursor (i.e. at 4 and 6 orders). Additional sideband cursors (5 by default) will each be located an additional ±1 order away.
Default settings
- Number of sidebands = 5. Change the number of sidebands by using the left and right arrows next to 'Sidebands' in the information box to the right of the spectrum plot.
- The base cursor is placed at 50% of the frequency range.
- Sidebands are placed at ±1x, ±2x ... ±5x the base frequency.
Move base cursor
- Move the base cursor by selecting it with the mouse and dragging it along the frequency axis to the desired location.
Note: When moving the base cursor, the sidebands will also move to maintain ±1x, ±2x, ... ±5x the interval from the base frequency.
Move sidebands
- Move a sideband cursor by selecting it with the mouse and dragging it along the frequency axis.
Note: When moving a sideband cursor, the base frequency is not changed, and the sidebands are moved to maintain the same distance between them.
Cursor details
- The cursor details area below the chart displays the delta value of the band, the frequency and the amplitude for the base cursor and each sideband cursor.
- The number of sidebands can be adjusted using the left and right arrows.
Harmonic Cursor
The Harmonic cursor is only available for the Spectrum chart. The cursor displays cursors at integer multiples of the base cursor. If the base cursor is located at 1x rpm, harmonics will appear at 2x, 3x, 4x, etc.

Default settings
- Number of harmonics displayed = 10. Alter the amount of harmonics by using the left and right arrows in the cursor details area.
- The base cursor is placed at 1x rpm when information of the speed of the machine is available.
- The base cursor is placed at 50% of the frequency range if the speed of the machine is not known.
- Harmonic markers are placed at 2x, 3x ...10x of the base frequency.
Move base cursor
- Move the base cursor by selecting it with the mouse and dragging it along the frequency axis to the desired location.
- Move the base cursor by using the left & right arrows in the information box to the right of the spectrum plot.
Note: When moving the base cursor, the harmonics will be moved to maintain
2x, 3x, 4x of the base frequency.
Move harmonic cursor
- Move a harmonic cursor by selecting it with the mouse and dragging it along the frequency axis.
Note: When moving a harmonic cursor, it will move a fraction of the last harmonic. (i.e. moving the harmonic at 10x the base frequency 1 bin to the left, the harmonic at 9x the base frequency will move 9/10th of a bin and snap to the closest bin, the harmonic at 8x the base frequency will move 8/10th of a bin and snap to the closest bin, etc.)
Cursor details
- The cursor details area is shown below the chart displays the frequency and the amplitude for each harmonic.
- You can control the number of harmonics (Harmonies) using the left and right arrows.
Single Cursor
The single cursors are available in the Waterfall, Spectrum and Timewave chart. The cursor is a base cursor that can be moved to any frequency and identifies the amplitude at that frequency.

Default settings
- The single cursor is placed at the frequency of the running speed.
Move
- Move the single cursor by selecting it with the mouse and dragging it along
the frequency axis to the desired location or use the arrow buttons in the
information box to the right of the plot.
Multiple cursors
- Add multiple instances of the single cursor by pressing Add cursor in the information box to the right of the plot.
Cursor details
- The cursor details area displays information about each cursors x and y values.
Band Cursor
The Band cursors are available in both the Spectrum and Timewave chart. The cursor is made up of three parts: the fundamental left line, fundamental right line, and the bandwidth. Band cursors sum the total energy contained within the frequency band and display the total energy value with the frequency range in the band.

Move
- Move the band cursor by selecting it with the mouse and dragging it along the frequency axis to the desired location (i.e. the width is kept the same, the left and right lines are moved by equal amounts).
- Move the left/right lines of the band cursor by placing the mouse on the left/right line and drag the line to the desired location.
Cursor details
Additional information is shown below each chart.
- Overall: Total energy within the band.
- Peak: The amplitude of the highest peak within the band.
- Start: X-axis value of the left line.
- End: X-axis value of the right line.
- Width: Range of the band = Start - End.
- Delta: Shows the range of the band in Hz/CPM. (Only available for Timewave chart)
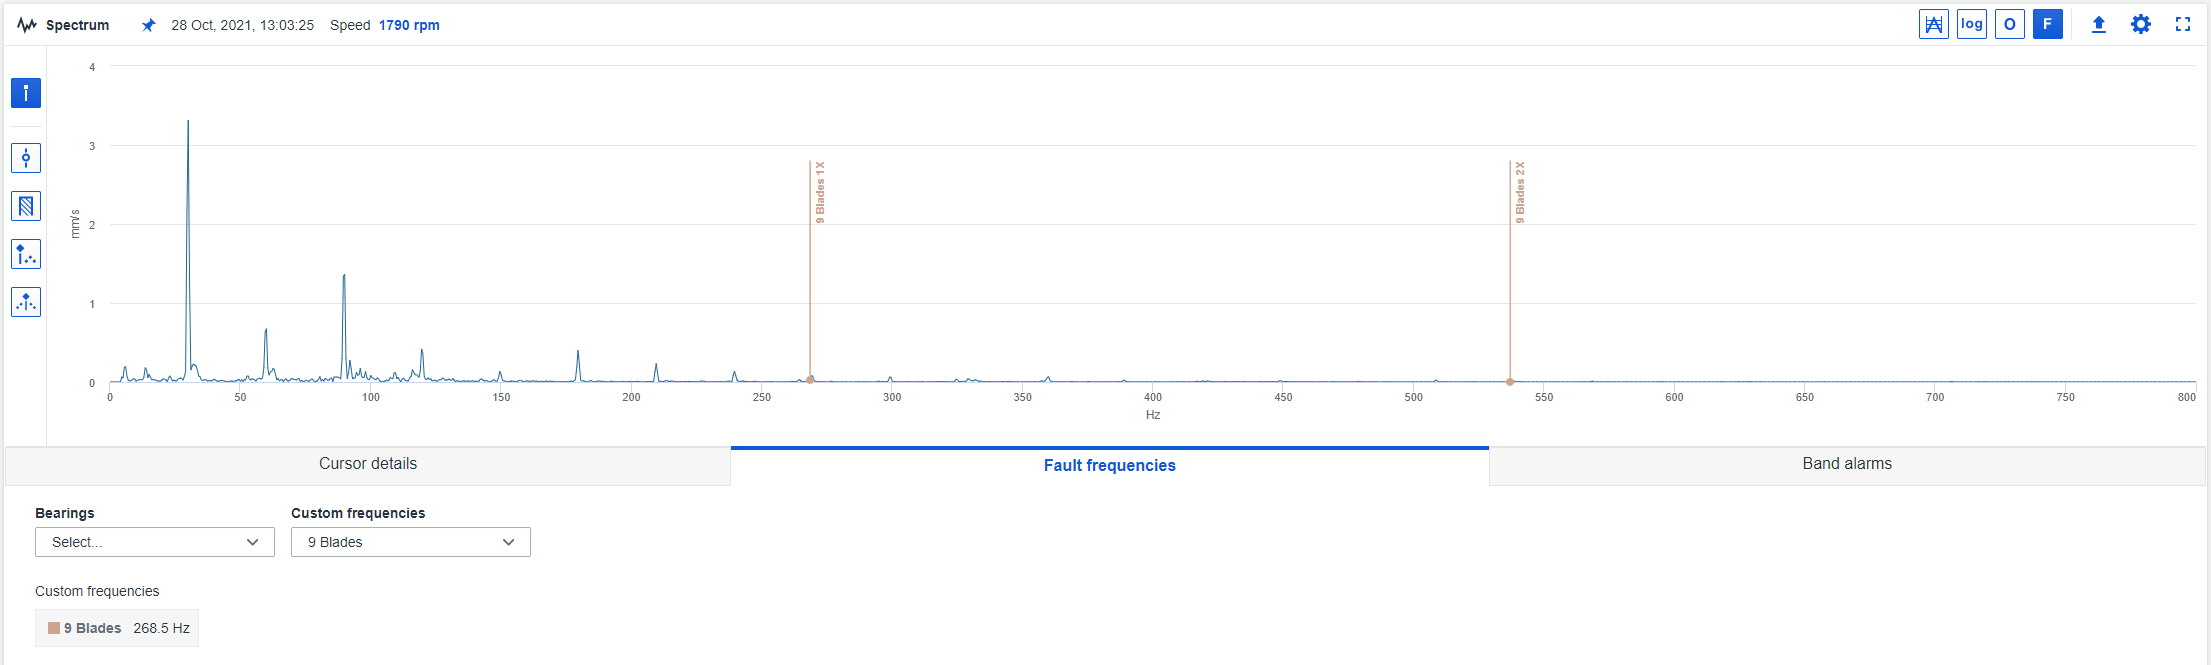
Fault frequencies
Fault frequency or Frequency overlay is available for the Spectrum chart. Fault frequency is used to label the points assigned frequency set(s) for identification and analysis of bearing defects. Fault frequency can be used if the following conditions are fulfilled:
- There is a given speed.
- A bearing is attached to the asset in Hierarchy or there exists custom fault frequencies
When a fault frequency is enabled it is displayed as a harmonic.
Bearing fault frequencies

All the bearings on the asset is available in the bearing dropdown. The bearing that belongs to the current point is indicated.
Each bearing has four possible bearing failing frequencies. When a bearing is selected BPFO and BPFI will be enabled by default. A description of all of the bearing failing frequencies can be found below.
- BPFO (Ball Pass Frequency Outer) or outer race failing frequency. Corresponds physically to the number of balls or rollers that pass through a given point of the outer race each time the shaft makes a complete turn.
- BPFI (Ball Pass Frequency Inner) or inner race failing frequency. Corresponds physically to the number of balls or rollers that pass through a given point on the inner track each time the shaft makes a complete turn.
- BSF (Ball Spin Frequency) or rolling element failing frequency. Corresponds to the number of turns that a bearing ball or roller makes each time the shaft makes a complete turn.
- FTF (Fundamental Train Frequency) or cage failing frequency. Corresponds to the number of turns that makes the bearing cage each time the shaft makes a complete turn.
Custom frequencies
Custom frequencies, defined in Aptitude Analyst is synced to Enlight Centre. In the custom frequency dropdown, you can choose which custom frequencies to display.
If you need to add or delete custom frequencies, you can do it in Aptitude Analyst and it will be synced to Enlight Centre in a couple of minutes.
Comments
0 comments
Article is closed for comments.