
Rate of Change (RoC) is one of the conditions shown in the Streamline detection flow. It applies only to vibration measurement points, i.e. velocity, acceleration, and enveloped acceleration.
RoC(n) = ((X(n) - X(n-1))/X(n-1)) * 100
Thresholds used:
| Type of measurement | Alert threshold | Danger threshold |
| Velocity | 200 | 500 |
| Enveloped acceleration | 120 | 500 |
| Acceleration | 120 | 500 |
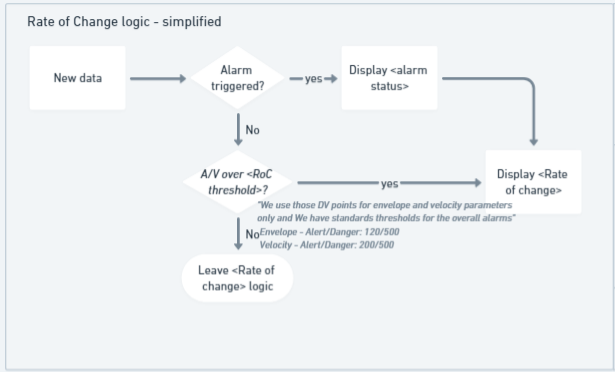
Rate of Change logic
When displaying RoC in the Analyze tab, in Enlight Centre, there are three different scenarios that can apply:
Scenario 1: A measurement point (MP) is in alarm
In this scenario, the Analyze tab will register the alarm and that alarm and the RoC will be displayed in the 'Reasons for analysis' column.

In the example image above, a velocity MP has triggered an alarm and therefore alarm status, measurement value, measurement units and the associated RoC are now all displayed in one box. The small arrow before the RoC percentage indicates whether that change is increasing or decreasing, in this example, it is decreasing.
Scenario 2: Alarm not triggered but RoC is above its own thresholds
In this scenario, the measurement value, units, and the high RoC percentage will be displayed and the asset will appear in the analyze asset list to be manually analyzed.

Scenario 3: Insufficient data to calculate RoC
If there is only one MP data value in the system, then there can be no RoC calculated since as described earlier, RoC requires at least two measurements. As shown in the image below, this situation will be communicated by a dash displayed alongside the MP value and the measurement units.

Please note that RoC is not calculated for frequent data, and measurement points for frequent data will be displayed as in scenario 3.
Rate of Change visualization
Rate of Change (RoC) is displayed in the same Reasons for analysis (Rfa) sticker as overall alarms in the smart list. The sticker contains information on the overall alarm and the RoC for the failing measurement point. This does not necessarily mean that the measurement point with the overall alarm has the largest RoC.
To prevent the analyst from missing a critical RoC event, the largest increasing RoC for the same asset is displayed in addition to the overall alarm sticker.

Note: If the most severe RoC is on the same measurement point as the overall alarm, only the overall alarm sticker will be displayed.
The menu card in the details view has been updated to show RoC for all measurement points. The red arrow indicates danger alarm, yellow indicates alert alarm, and grey is used for values below configured thresholds.

Comments
0 comments
Please sign in to leave a comment.