
Asset menu
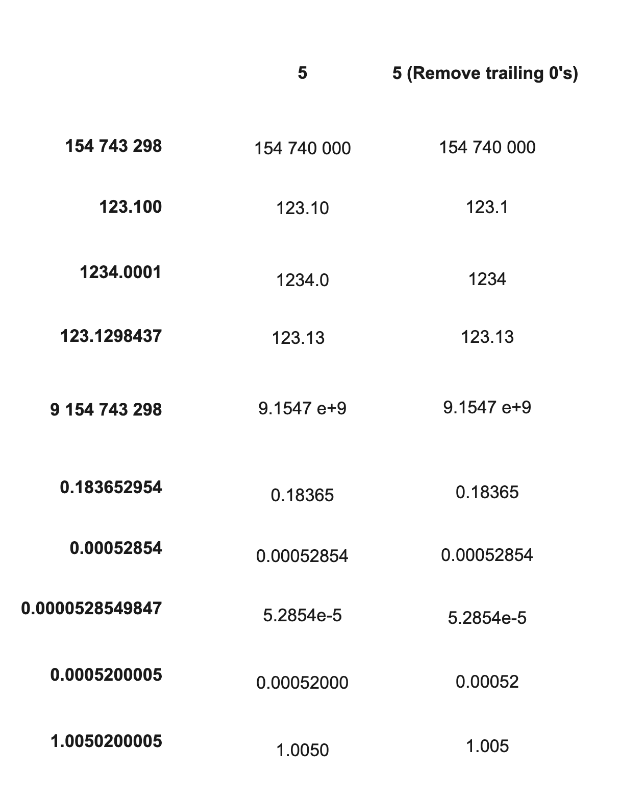
The value for each measurement point on the asset is displayed in the Asset menu, found on the left side of the graph. The values are rounded to 5 significant digits to maintain readability. Scientific notation is used if the rounded value consists of more than 9 digits (ex). Trailing zeroes are also removed.
Graphs
Trend, Waterfall, Heatmap, Spectrum, and Timewave graphs help determine if machinery condition changes are occurring and if so, help with analyzing the cause of machinery condition changes.
Select an Asset in the list to display a detailed view of the available measurement points and assets that belong to the same functional location. Once you click on that asset, detailed trends and graphs are displayed on the detail view page.
- Select an Asset in the list.
- Select a measurement point in the Asset menu to display Trend graphs.
- Waterfall graph will be displayed if available.
- Heatmap graph will be displayed if available.
- Spectrum graph will be displayed if available.
- Timewave graph will be displayed if available.
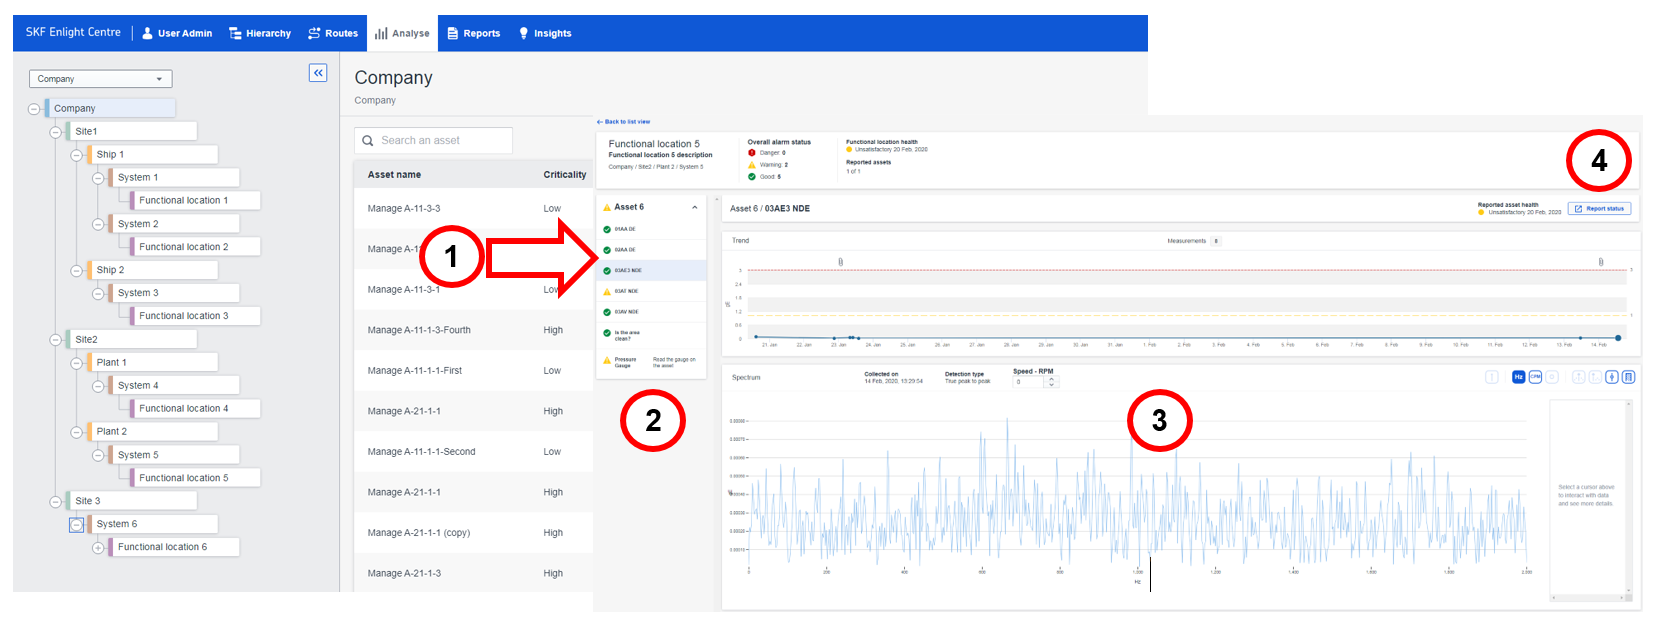
Analyze - Detail view page
Comments
0 comments
Article is closed for comments.