
The Overview tab in the Insights panel displays a dashboard showing key graphs and Key Performance Indicators (KPIs) from the Insights menu.
Three areas are displayed: Asset health, Recommended actions and Faults.
For details about the data in the graphs, click on any of the graphs to go to desired sub menu.
- Select the Insights panel in the main menu.
- Overview will show in the Insights menu.
- The Asset Health widget displays graphs and KPIs of the accessible assets:
- KPI displays the number of assets that has the reported status Unacceptable.
- Graph displays Asset Health Statuses for the assets.
- Graph displays Asset Health Statuses by Criticality for the assets.
- Click anywhere on the Asset Health widget and it will take you to the Asset Health section.
- The Recommended actions widget displays graphs and KPIs about recommended actions created in Reports for your assets:
- KPI displays the number of reported recommended actions that is open in Reports.
- Tree graph displays the 5 most common Open Recommended Actions reported on the assets.
- Bar graph displays Open Recommended actions by Criticality reported on the assets.
- Click anywhere on the Recommended actions widget and it will take you to the Recommended actions section.
- The Faults widget displays graphs and KPIs of Faults and Fault types reported on the assets:
- KPI showing the number of Faults set to Done in Reports.
- Graph showing the 5 most common Fault Types set to Done reported on the assets.
- Graph showing Faults by Severity reported on the assets.
- Click anywhere on the Faults widget and it will take you to the Faults section.
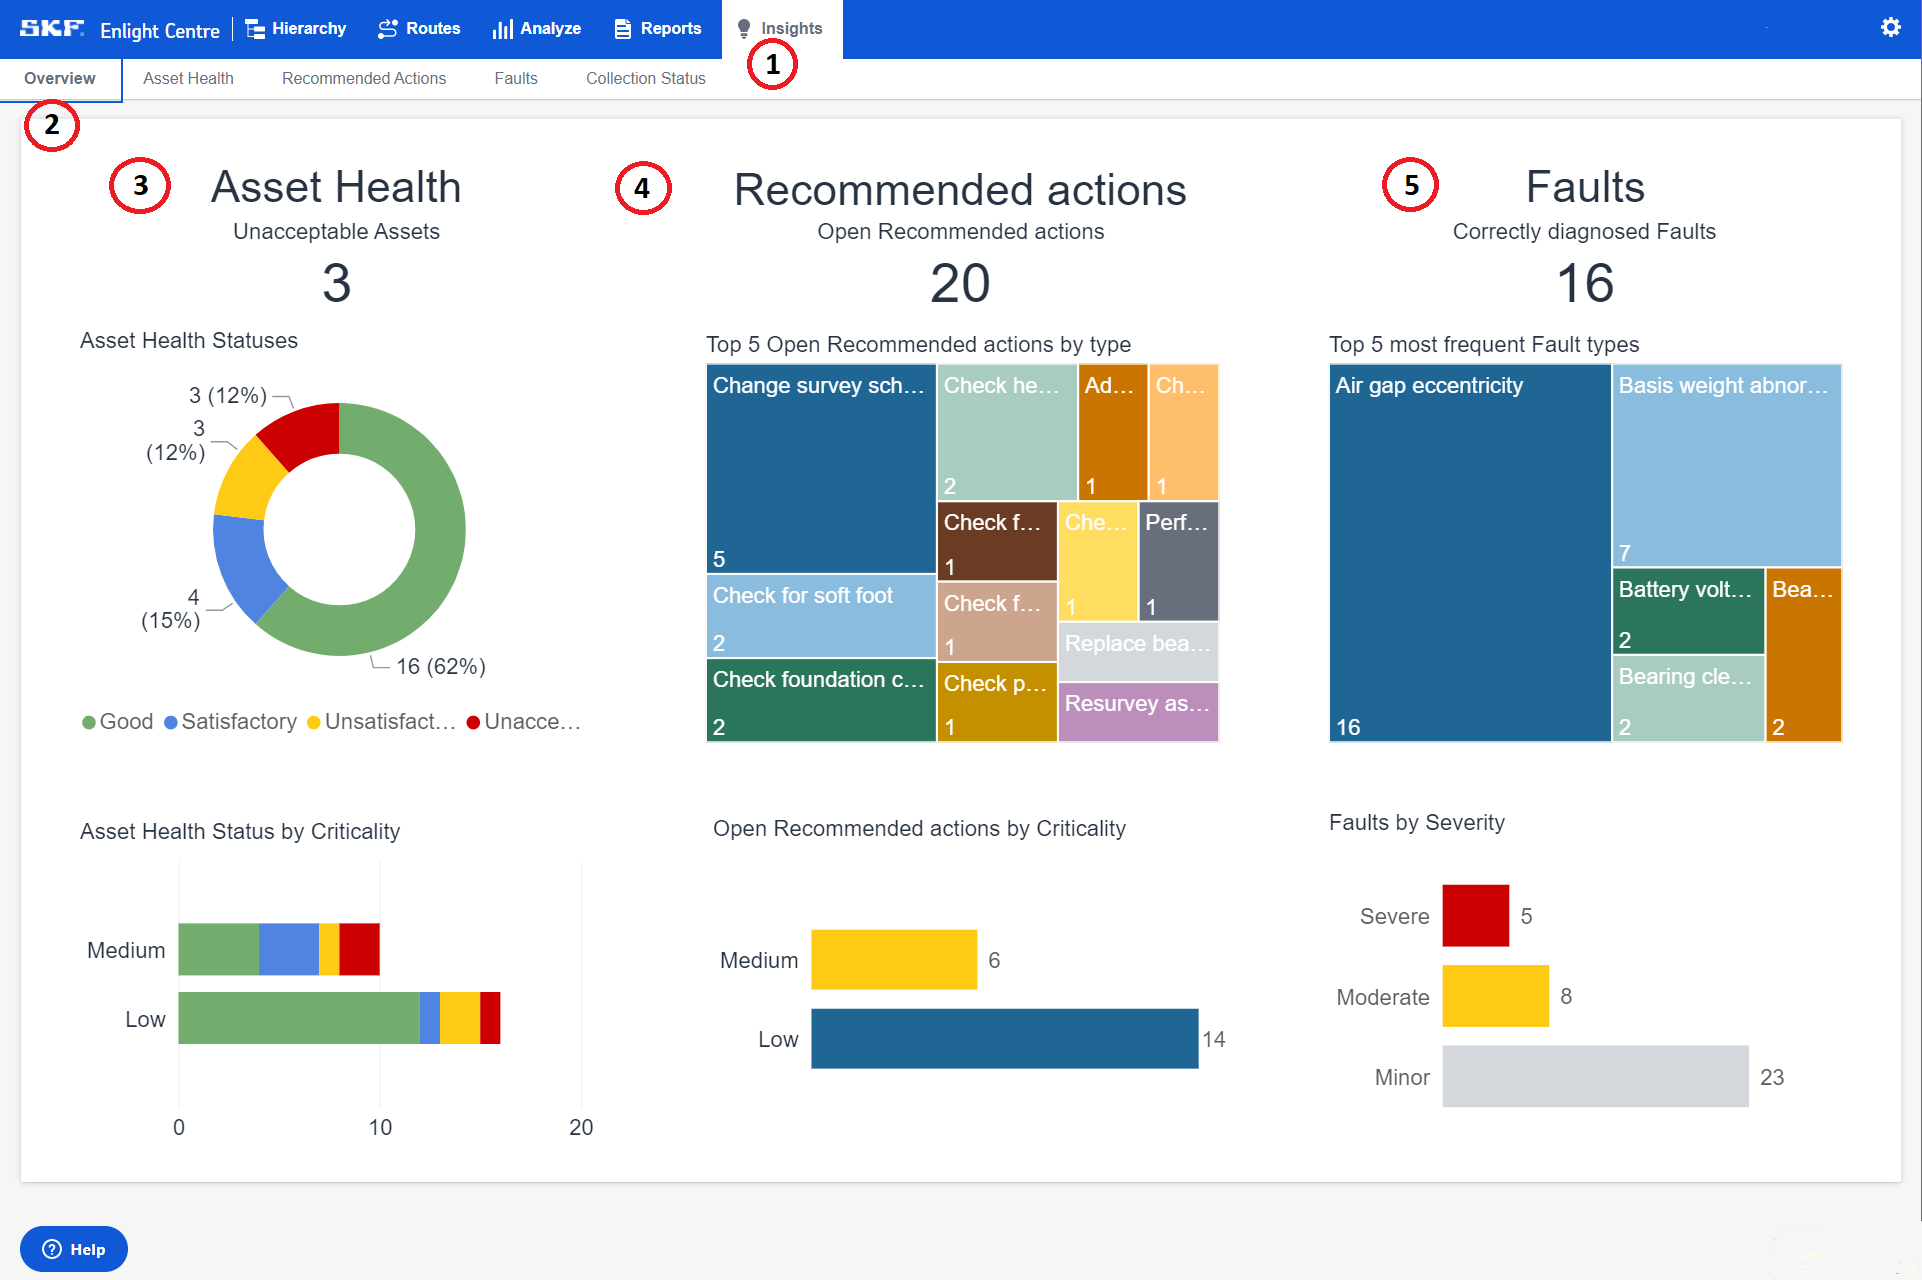
Insights - Overview
Comments
0 comments
Article is closed for comments.